
How accurate is TrackStat's step length? Measured against OptoJump
A head-to-head on step length — TrackStat's frame-by-frame video digitisation vs an OptoJump optical system, across 14 acceleration steps.
Contact time and flight time from high-speed video have been trusted in sprint research for decades — that part isn’t in question. The thing coaches actually wonder about a camera-based tool is different: can you pull step length, a spatial measurement, accurately off a video?
To find out, TrackStat was run head-to-head against an OptoJump optical measurement system — a lab-grade reference — comparing step length step for step.
The setup
One athlete, accelerating out of the blocks through a calibrated 10-metre zone, filmed for TrackStat with an OptoJump laid down alongside to capture the same steps. Two reps, fourteen acceleration steps in total — from a 0.47 m first step out to a 1.80 m stride at top-end acceleration.
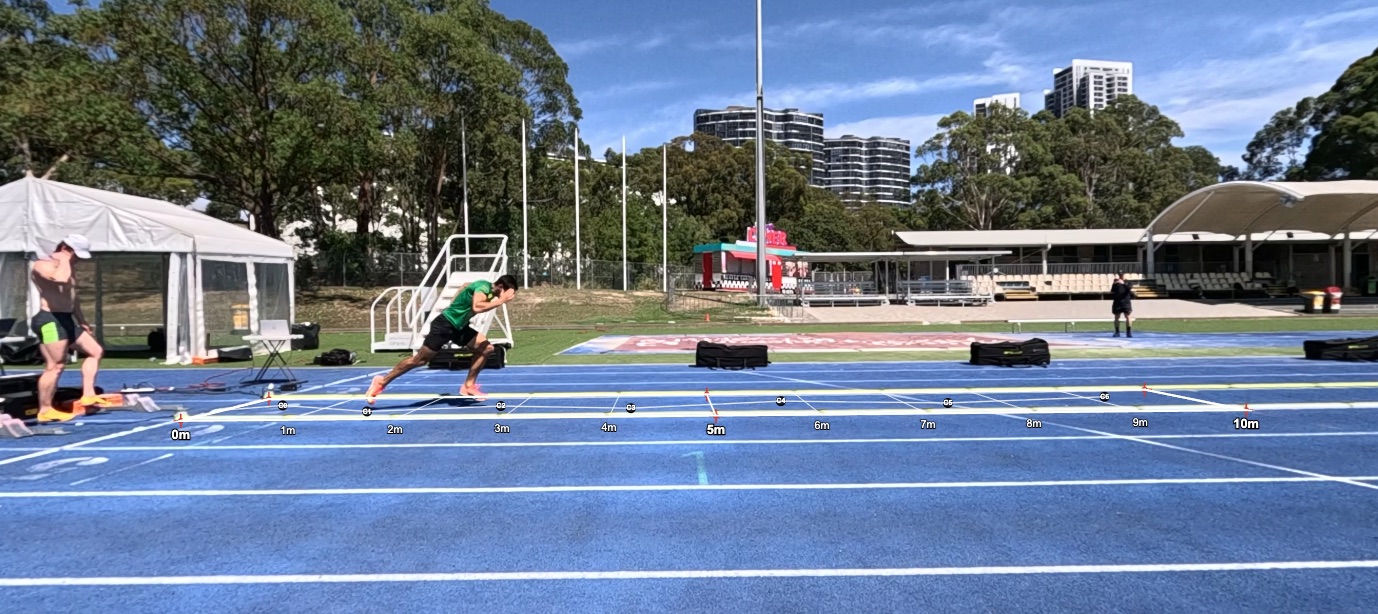
The calibrated 10 m zone — filmed for TrackStat, with an OptoJump laid down alongside to capture the same steps.
The result
Difference per step — TrackStat minus OptoJump, split by rep.
Across all 14 steps, TrackStat matched OptoJump to within about 1.3 cm on average — the biggest single-step gap was just 3 cm, with no tendency to read long or short. On steps averaging over 1.3 m, that’s roughly 1% error.
For context, an OptoJump is a lab-grade optical system — around $30,000 for a 10-metre setup, roughly $3,000 a metre. These step lengths came from a single camera on a tripod.
The step-by-step numbers
Rep 1 — acceleration step length (m)
| Step | OptoJump | TrackStat | Diff |
|---|---|---|---|
| 1 | 0.57 | 0.60 | −0.03 |
| 2 | 1.06 | 1.05 | +0.01 |
| 3 | 1.28 | 1.29 | −0.01 |
| 4 | 1.40 | 1.39 | +0.01 |
| 5 | 1.54 | 1.53 | +0.01 |
| 6 | 1.58 | 1.59 | −0.01 |
| 7 | 1.76 | 1.74 | +0.02 |
Rep 2 — acceleration step length (m)
| Step | OptoJump | TrackStat | Diff |
|---|---|---|---|
| 1 | 0.47 | 0.47 | 0.00 |
| 2 | 1.07 | 1.08 | −0.01 |
| 3 | 1.26 | 1.28 | −0.02 |
| 4 | 1.37 | 1.36 | +0.01 |
| 5 | 1.57 | 1.56 | +0.01 |
| 6 | 1.66 | 1.66 | 0.00 |
| 7 | 1.77 | 1.80 | −0.03 |
Caveats
This is one athlete, one session, acceleration steps only — fourteen data points. It’s an encouraging first look, not a peer-reviewed validation study, and it’s presented as exactly that. More athletes, phases and reps will be added over time, with the numbers shared as they come in. Anyone with an OptoJump (or similar) is welcome to run their own comparison.