
Measure.
Analyse.
Improve.
The performance platform for speed.
Built by coaches, for coaches.
| Step | Leg | Phase | Step Length (m) | Contact Time (s) | Flight Time (s) | Step Freq (Hz) | Step Velocity (m/s) |
|---|---|---|---|---|---|---|---|
| 0 | Right | R to L | 2.18 | 0.112 | — | — | — |
| 1 | Left | L to R | 2.00 | 0.110 | 0.120 | 4.32 | 8.64 |
| 2 | Right | R to L | 2.08 | 0.106 | 0.116 | 4.34 | 9.03 |
| 3 | Left | L to R | 2.05 | 0.114 | 0.118 | 4.28 | 8.77 |
Your Athletes.
All in One Place.
Every athlete gets a profile. Every session, any test you run, and every competition feeds into it. Over time, you see the full picture — and the guesswork disappears.

| Step # | Leg | Step Phase | Step Length (m) | Contact Time (s) | Flight Time (s) | Step Frequency (Hz) | Step Velocity (m/s) | View |
|---|---|---|---|---|---|---|---|---|
| 0 | Left | L → R | 0.40 | 0.104 | — | — | — | 3 |
| 1 | Right | R → L | 2.41 | 0.090 | 0.123 | 4.69 | 11.31 | 3 |
| 2 | Left | L → R | 2.38 | 0.088 | 0.121 | 4.78 | 11.39 | 3 |
| 3 | Right | R → L | 2.43 | 0.092 | 0.124 | 4.63 | 11.25 | 3 |
| 4 | Left | L → R | 2.39 | 0.089 | 0.122 | 4.74 | 11.33 | 3 |
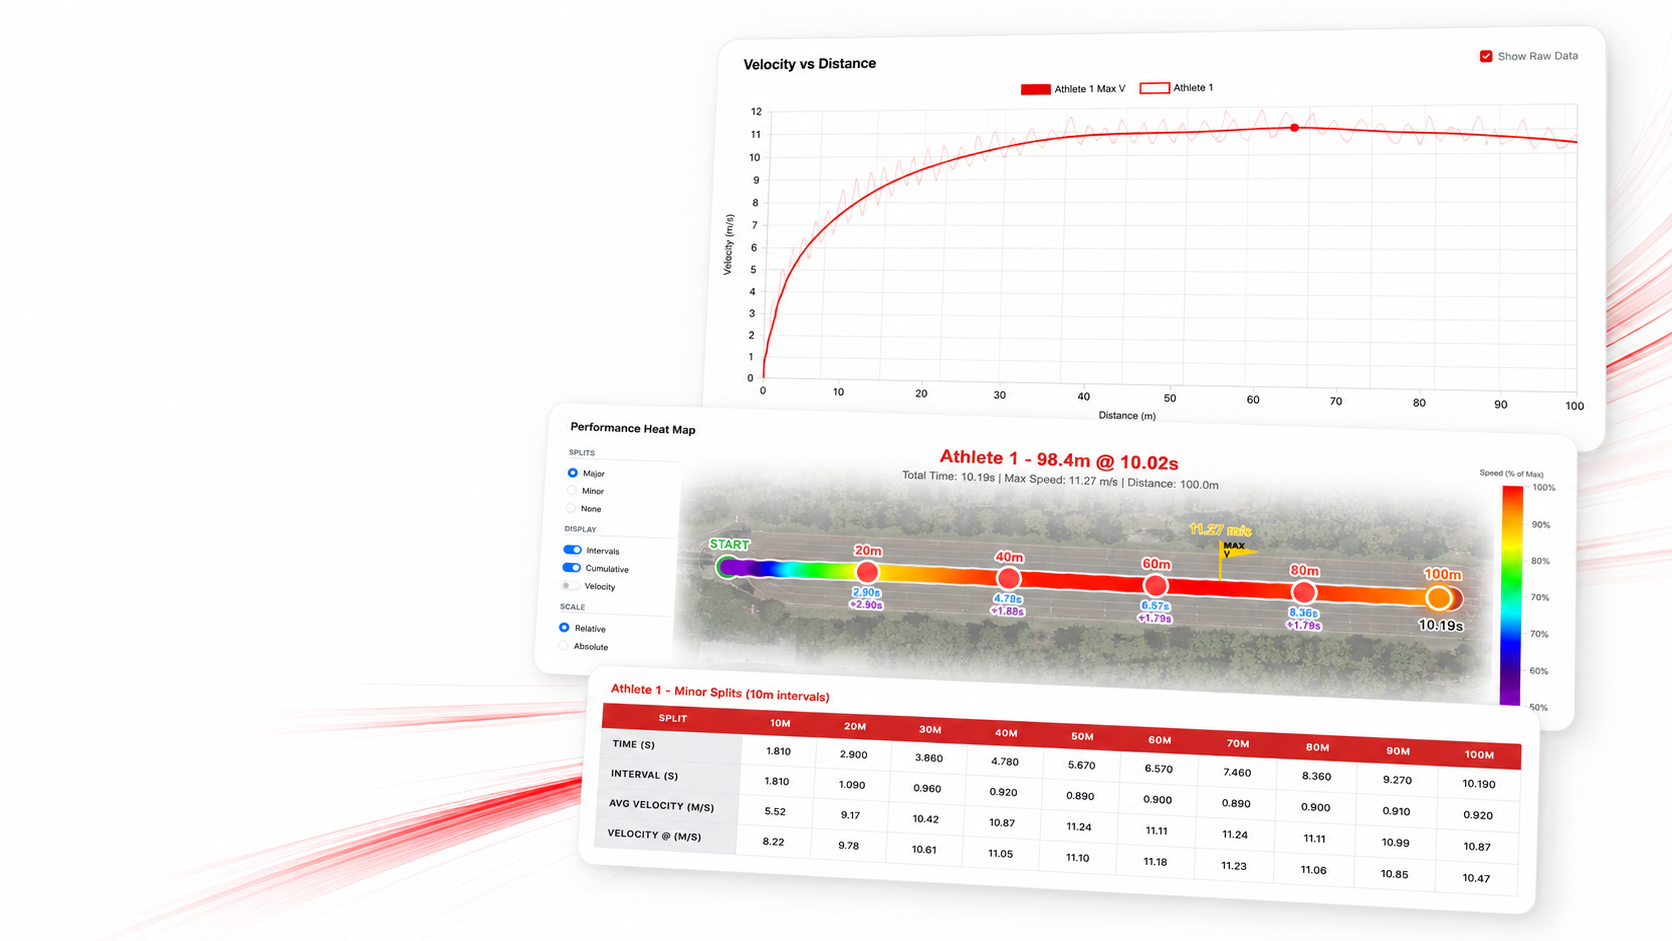
See where the race was won.
With Pro: GPS data that brings every race to life. Analyse acceleration, max velocity, and deceleration phases to identify key moments and make smarter training decisions.
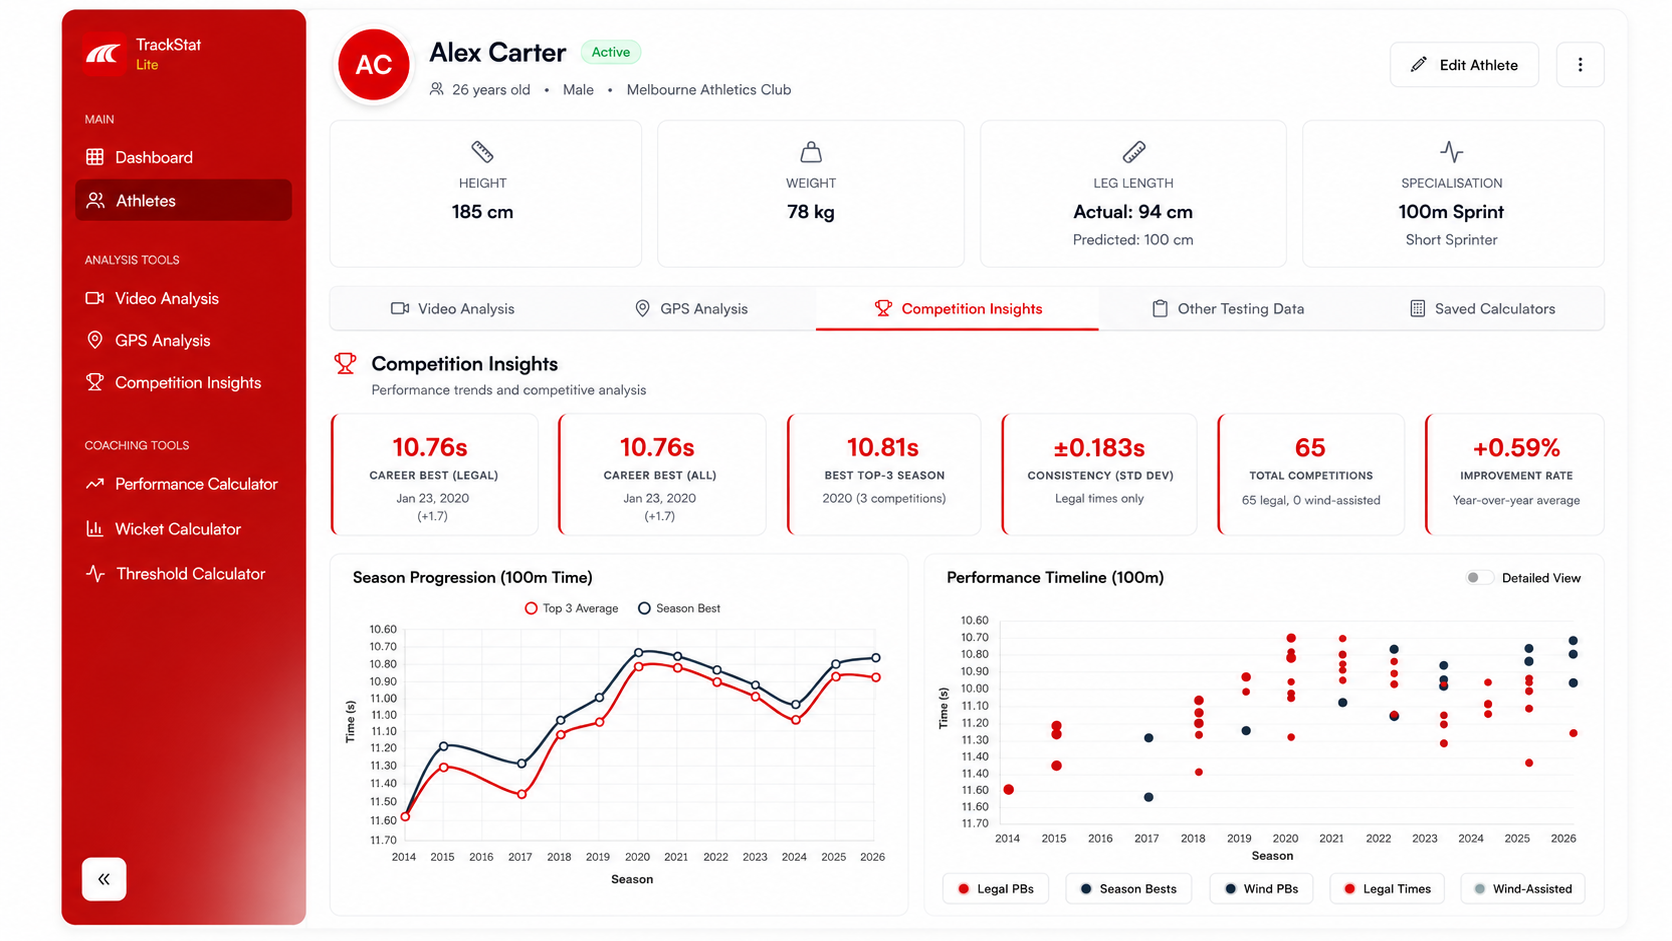
Track every race, spot every trend.
With Pro: log every competition result and TrackStat turns it into insight — season progression, personal bests, consistency and improvement rate — all on one athlete profile, alongside their video and testing data.
Start with Lite,
grow into Pro.
Lite covers up to 20 athletes with full video analysis and coaching tools. Pro unlocks GPS race analysis, competition insights and the lactate calculator for up to 40 athletes. Club — for schools, clubs and academies — is on the way.
One all-in price — no usage meter. Analyse every video and every GPS race as often as you like. No per-report fees, no per-analysis credits.
$240 billed yearly · AUD · save $180
The essentials for individual coaches — up to 20 athletes and full video analysis.
Start free trial14-day free trial — no charge until it ends
Everything you need to start analysing sprints today. Upgrade to Pro any time for GPS, competition insights and lactate.
$600 billed yearly · AUD · save $120
The complete platform — every tool unlocked, for a coach and their squad.
Start free trial14-day free trial — no charge until it ends
Speed, acceleration and split-by-split breakdowns from any GPS unit.
Benchmark athletes against meet results, rankings and season bests.
Plot lactate curves to dial in training zones and thresholds.
The full TrackStat platform — every tool unlocked.
For schools, clubs & academies · pricing to come
Everything in Pro, scaled for a whole program — and every athlete kept, season after season.
Register interestNo commitment — we'll tell you when it's ready
Built for programs tracking a whole roster. Register your interest and help shape what's in it.
Practical guides for coaching by the numbers.
A growing library of straight-talking guides on sprint analysis, metrics and drills — built from real coaching, no filler.
Camera angle, frame rate and lighting — the setup that makes every step easy to mark up.
Read guideWhat each spatiotemporal metric tells you about an athlete — and what to do with it.
Read guideTurn each athlete's leg length and current velocity into individualised drill distances.
Read guideThe honest answers to the questions you're about to ask.
Still need something? Email info@trackstat.app and a real coach will reply.
Measure. Analyse. Improve.
The all-in-one platform built for sprint coaches and performance teams.